With sufficient quantities of food in an affluent society and raised public awareness of environmental quality, there is growing concern about the quality of food and demand for more accountability of how food is grown. Several studies of historical food composition tables show an apparent decline in food nutrient content over the past 70 years. This decline has been attributed to soil degradation and the “mining” of soil fertility by industrial agriculture. In this presentation, USDA food composition tables are reexamined and factors of food nutrient content will be related to soil quality. Plant nutritional needs are determined and links to soil fertility management and land use patterns are discussed. For major cations of selected fresh produce crops, ternary diagrams show no real loss in the balance of mineral nutrition in food crops. Although it may be hypothesized that a decline in soil quality has led to an apparent decline in food nutrition, more controlled studies are needed to factor out the many variables associated with the food composition tables and this type of analysis.
At the end of the Twentieth Century, food security is no longer an issue for an affluent society. The production of food is now in excess of the United States populations’ needs and the diversity of food choices at the supermarket has greatly increased as well as the year round availability of once seasonal produce. With the development of plant breeding, machinery, fertilizers and other farm chemicals, the United States has seen an increase in yield per acre (Table 1) that provides enough food to maintain food security. The past 30 years has seen a raised public awareness of the environment, with air and water quality being the main issues. But now, ironically, as soils are producing a surplus of food, conventional farming and soil quality have now come into contention.
| Table 1. Average Yields of Major Crops in the United States, 1950-92 (Tisdale et al., 1999) | ||||
|
Year |
Corn (bu/acre) |
Wheat (bu/acre) |
Soybean (bu/acre) |
Alfalfa (ton/acre) |
|
1950 |
37.6 |
14.3 |
21.7 |
2.1 |
|
1964 |
62.1 |
26.2 |
22.8 |
2.4 |
|
1972 |
96.9 |
32.7 |
28.0 |
2.9 |
|
1982 |
113.2 |
35.5 |
31.5 |
3.4 |
|
1992 |
128.7 |
41.4 |
37.0 |
3.6 |
Is Chemical Farming Making Our Food Less Nutritious? An open letter by Cheryl Long (1999), the Senior Editor of Organic Gardening (Rodale Press), addressed to USDA Secretary Dan Glickman asked this very question. According to two studies mentioned in the letter, the vitamin and mineral content of American and British food appear to be declining. One study, titled “Nutrition Under Siege” (Jack, 1998), examined data published by the USDA ARS Nutrient Data Laboratory and concluded that a comparison of the data “show(s) a sharp decline in minerals, vitamins and other nutrients in many foods since the last comprehensive survey published over twenty years ago”, which was attributed to “a steady deterioration in soil, air, and water quality”. In a similar study (Mayer, 1997), Anne-Marie Mayer compared British data over a fifty year period and noted “significant reductions” in the levels of minerals in fruit and vegetables and questioned if modern agriculture could be responsible for the reduction. Long’s letter to the USDA expressed concern that these stated declines “may well be a result of the ‘mining’ of our nation’s soil fertility by intensive chemically based agriculture”.
The USDA has been compiling nutritive data of foods since the late 1800’s and published the first data tables in 1896 (Atwater, 1896). The first extensive revision was in 1950 with the publication of Agriculture Handbook no. 8, which was subsequently revised in 1963 (Watt, 1963), 1976, and 1990. The USDA Nutrient Database for Standard Reference (SR13, 1999) is the most current version of the food composition tables.
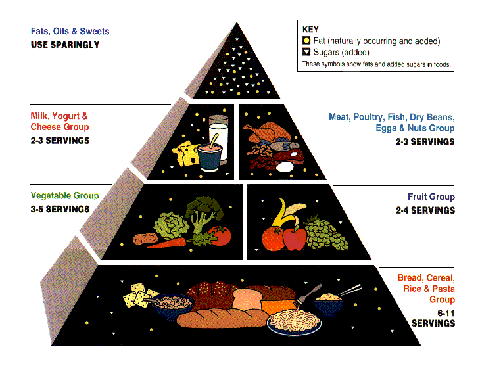
| Data for the tables were compiled from published and unpublished sources, by public and private sector research. SR13 contains information on over 6200 food items and is used in determining food label and nutritional guidelines. It is the backbone of the USDA Food Pyramid (Figure 1). | Figure 1. USDA Food Guide Pyramid (FNIC 2000) |
|
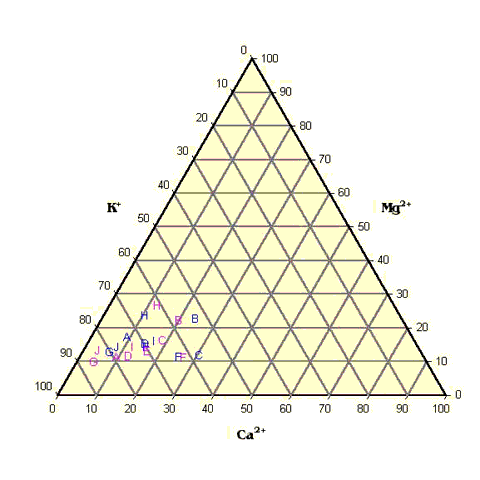
To further investigate this link between nutritional decline and soil quality, ten common fruits and vegetables were examined for their calcium, magnesium and potassium content. Ternary diagrams were constructed comparing the relative ratios of mineral charge of Ca2+, Mg2+ and K+ between 1963 and 1999 data (Watt, 1963, SR13, 1999). At first glance, the data in Table 2 suggest that there has been a reduction in the mineral content of the selected produce. However, when the ratio of cation charge of calcium vs. magnesium vs. potassium is plotted (Figure 2), there is virtually no difference in the mineral balance between the old and the new data.
| Table 2. Mineral Content of Selected Produce 1963 vs. 1999 - (mg/100g sample) | ||||||||
|
Produce |
Ca |
Mg |
K |
Percent Water |
||||
| 1963 | 1999 | 1963 | 1999 | 1963 | 1999 | 1963 | 1999 | |
| Apples, raw, with skin | 7 | 7 | 8 | 5 | 110 | 115 | 84.8 | 83.9 |
| Beans, snap, green, raw | 56 | 37 | 32 | 25 | 243 | 209 | 90.1 | 90.2 |
| Broccoli, raw | 103 | 48 | 24 | 25 | 382 | 325 | 89.1 | 90.6 |
| Carrots, raw | 37 | 27 | 23 | 15 | 341 | 323 | 88.2 | 87.7 |
| Lettuce, iceberg, raw | 20 | 19 | 11 | 9 | 175 | 158 | 95.5 | 95.8 |
| Oranges, raw | 41 | 40 | 11 | 10 | 200 | 181 | 86.0 | 86.7 |
| Peaches, raw | 9 | 5 | 10 | 7 | 202 | 197 | 89.1 | 87.6 |
| Peas, green, raw | 26 | 25 | 35 | 33 | 316 | 244 | 78.0 | 78.8 |
| Strawberries, raw | 21 | 14 | 12 | 10 | 164 | 166 | 89.9 | 91.5 |
| Tomatoes, red | 13 | 5 | 14 | 11 | 244 | 222 | 93.5 | 93.7 |
| Figure 2. Percent Cation Charge - Calcium vs. Magnesium vs. Potassium - per kg dry matter for Various Produce from Old and New USDA Data (Watt, 1963; SR13, 1999) | |||||||||||||||||||||||
Old vs. New |
 |
||||||||||||||||||||||
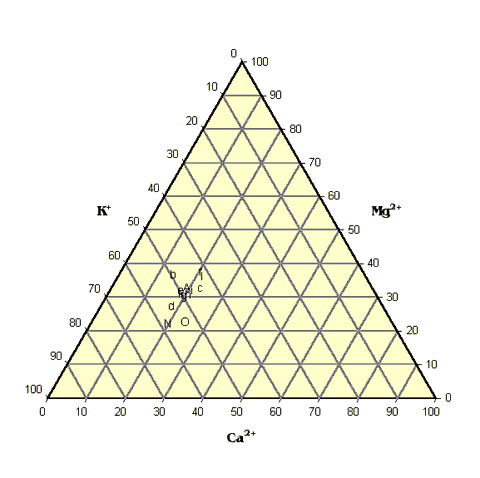
A study by Bear et al. (1948) found wide variation in the cation-summation values for snap-bean between various regions due to the effects of different soil types and varying climatic conditions. A ternary diagram for this data (Figure 3) shows similar mineral balance consistent with the USDA data. Ironically, this study has been misinterpreted as proof that organic agriculture produces a “significantly superior” crop than conventional agriculture (Heckman, 1991).
| Figure 3. Percent Cation Charge - Calcium vs. Magnesium vs. Potassium - per kg. dry matter for Snap Bean from Bear et al. (1948) and Old and New USDA Data (Watt, 1963; SR13, 1999) | ||||||||||||||||||||||||||||||||||||||||||||||||||||||||||||||||||||||||||
|
 |
|||||||||||||||||||||||||||||||||||||||||||||||||||||||||||||||||||||||||
The relatively stable relationships among the three macronutrient cations argues that either all three are being depleted proportionally from soils or, alternatively, none of them is depleted in soils and that alternative explanations must be sought for changes in composition when observed. The widespread use of soil testing and fertilizers as part of the strategy for the increasing yields of modern agriculture also argues strongly against the notion of widespread soil depletion of mineral nutrients.
Atwater, W. O. and C.D. Woods. 1896. The chemical composition of American food materials. U.S. Off. Expt. Stas., Expt. Sta. Bul. 28.
Bear, F.E., S.J. Toth, and A.L. Prince. 1948. Variation in mineral composition of vegetables. Soil Sci. Soc. Am. Proc. 13:380-384.
FNIC. 2000. Food and Nutrition Information Center Home Page: http://www.nal.usda.gov/fnic/
Heckman, J.R. 1991. Misquotes of “Variation in mineral composition of vegetables”. Soil Sci. Soc. Am. J 55:1508
Jack, A. 1998. Nutrition under siege. One Peaceful World. No. 34. Becket, MA.
Mayer, A-M. 1997. Historical changes in the mineral content of fruits and vegetables: a cause for concern?. p. 69-77 In W. Lockeretz, (ed). Agriculture Production and Nutrition: Proc. Sept 1997. Tufts University.
Long, C. 1999. Is chemical farming making our food less nutritious?. Org Gardening. Nov/Dec 1999. p. 12.
Tisdale, S.L., J.L. Havlin, J.D. Beaton, and W.L. Nelson.1999. Soil fertility and fertilizers; an introduction to nutrient management. Prentice Hall, Upper Saddle River, NJ.
Watt, B. K. and A. L. Woods. 1963. Composition of foods; raw, processed, prepared. USDA Handbook no. 8.
U.S. Department of Agriculture, Agricultural Research Service. 1999. USDA Nutrient Database for Standard Reference, Release 13. Nutrient Data Laboratory Home Page, http://www.nal.usda.gov/fnic/foodcomp
This presentation was originally presented in poster form at the 2000 Annual Meetings of the ASA/CSSA/SSSA, Nov 5-9, 2000, Minneapolis MN. All rights reserved to the authors, J.W. Lyne(jwlyne@students.wisc.edu) and P. Barak (pwbarak@facstaff.wisc.edu).