Example 2-DE Gels
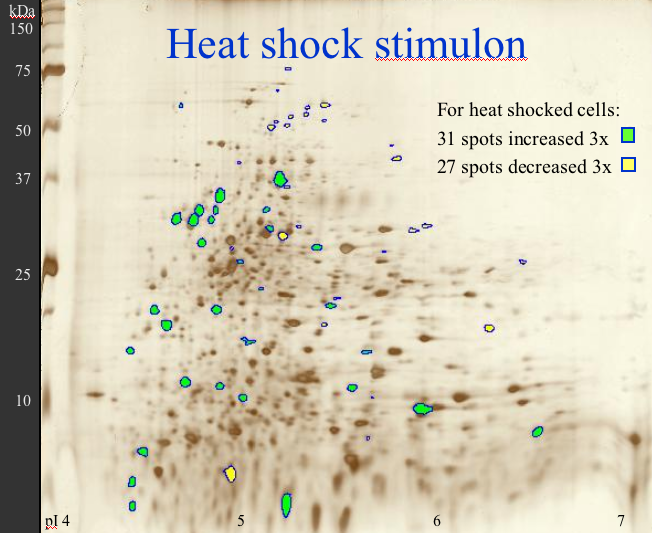
The gel to the left is digital sum of a gel from
a non-stressed cell and a heat-shocked cell. Digital image analysis is used
to identify protein spots that change in abundance in the heat-shock sample
realtive to amounts in the non-stressed cells. Heat-shock-regulated proteins
are identifed as green (increase under stress) or yellow (decrease under
stress).
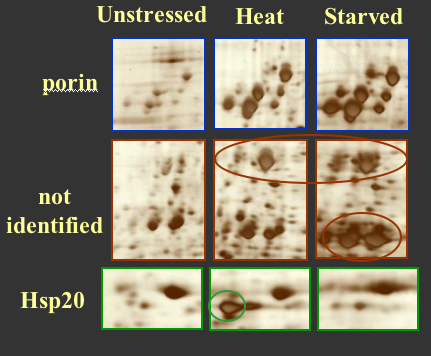
Starvation and heat-shock have both a common set of proteins
they induce as well as some that are unique to each stress. The panel at
left shows zoom views of 2-DE sections that illustrate proteins showing these
behaviors. The top panel is a protein cluster identified by mass spectrometry
as a general diffusion porin. Proteins in the middle panel have not yet been
identified. The bottom panel shows a protein identified as a small heat-shock
protein. The porin and unidentifed proteins are both up-regulated by starvation
and heat shock. The heat shock protein is not induced by stravation.